
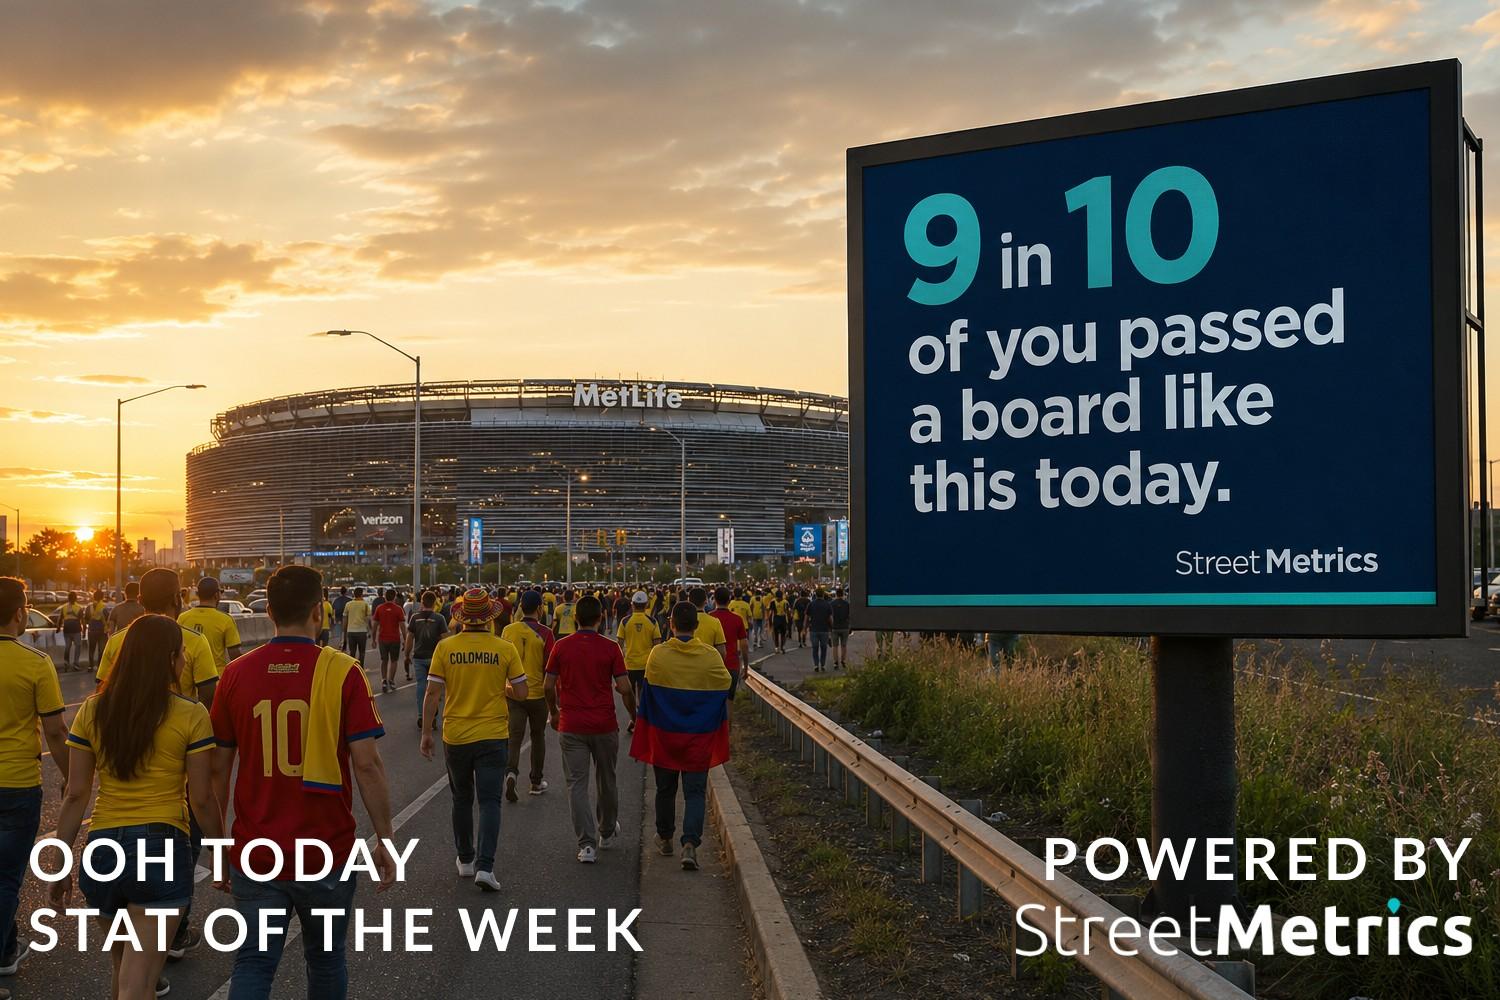

A sponsored StreetMetrics analysis published by OOH Today reported that nine in ten measured attendees passed out-of-home advertising on both legs of their journey to and from the Brazil–Morocco World Cup match at MetLife Stadium. When the analysis counted only one operator’s digital inventory, the reported figure was one in five.
The gap is the story. It illustrates how a plan, measurement report or inventory map can understate the role of OOH when it sees only one owner, one format or one part of a journey.
What was reported
These are case-study findings supplied by StreetMetrics, which sponsored the OOH Today post. The publication did not provide a confidence interval, sample size or full match-level methodology in the article. Advertisers should therefore treat the figures as a useful directional case, not a guaranteed benchmark for every match, stadium or city.
- Match studied: Brazil vs Morocco at MetLife Stadium
- Exposure to one operator’s digital inventory: 1 in 5 attendees
- Exposure across 16 tracked operators: 9 in 10 attendees
- Full-market exposure on return journey: 9 in 10 attendees
- Attendees stopping at a store or restaurant inbound: 1 in 3
- Attendees stopping outbound: 1 in 5
- Minimum stop definition: 5 minutes
Why a single-owner view can mislead
Major-event audiences rarely follow one path. They pass through airports, rail stations, roads, hotels, shopping areas, fan zones, restaurants and the stadium district. Each environment may be controlled by a different media owner.
A plan built around one operator can still be effective, particularly when that owner has strong coverage. But it should not be confused with a complete view of the market. The reported difference between 20% and 90% exposure in this case shows why buyers should distinguish:
The last number is the one that matters to a buyer. A map showing that OOH exists along a journey does not mean the campaign bought every screen, ran at the right time or delivered an ad when each attendee passed.
- Operator reach: exposure available from one seller’s estate
- Market reach: exposure available across relevant owners and formats
- Campaign reach: the people the advertiser actually reaches after budget, dates, targeting and share of voice are applied
The inbound journey may be the higher-value moment
StreetMetrics also reported that one in three fans made a stop of at least five minutes at a store or restaurant on the way to the match, compared with one in five on the return journey.
That difference suggests two distinct communication roles:
Brands seeking immediate footfall may value the inbound window more heavily. Sponsors focused on memory and association may want both directions plus wider city coverage.
- Arrival in market: Planning transport, accommodation and activities - Establish brand presence and event association
- Inbound to match: Anticipation, group movement, food and retail stops - Drive purchase, visit or participation
- Stadium perimeter: Maximum event relevance and crowd density - Create fame, social content and sponsorship reinforcement
- Return journey: Dispersal, fatigue and lower stop propensity - Reinforce memory or promote the next action
- Following day: Tourism, travel and recap behavior - Retarget exposed audiences where privacy rules allow
Build an event plan around journeys, not a radius
A simple radius around a stadium misses how people actually arrive. Event planning should begin with movement corridors and dwell environments:
The best plan may combine fixed premium sites with broad transit coverage and a small flexible layer. Buying only the closest billboard can be expensive without covering the routes that carry most attendees.
- Map primary airports, rail terminals, park-and-ride sites and official shuttles.
- Identify fan zones, hospitality sites and sponsor activations.
- Separate commuter flows from match-attendee flows.
- Compare static, digital, transit and mobile inventory across owners.
- Align dayparts with gates, kickoff, transport and entertainment schedules.
- Reserve flexible inventory for changes in routes, weather or crowd concentration.
Measurement questions advertisers should ask
StreetMetrics says its broader methodology uses real mobility data and physics-based Display Exposure Zones derived from unit dimensions, height, facing and visual-resolution thresholds. For digital inventory, it says ad-play logs are required before an impression is counted.
Before accepting a post-campaign reach number, ask:
Those questions prevent an inventory-availability statistic from being mistaken for campaign delivery.
- Was the calculation based on all market inventory or only booked inventory?
- Were digital play logs matched to audience movement?
- How was a viewable exposure zone defined?
- How were devices expanded to represent the population?
- What privacy controls and minimum aggregation thresholds were used?
- Were people counted once for reach and repeatedly for frequency?
- Did the analysis separate passing the inventory from seeing the advertiser’s creative?

 London